How Can #Hashtagging Create Real Community Data?
One of the basic premises that this project is founded on, is the concept that people are going to want to be involved with their community, developing useful data and dialogue. If you don't believe that can happen to any great degree, I completely understand and probably share most of your doubts.
If you do believe that citizens can create public data, then how do they go about doing it? I'm going to suggest that Twitter and Instagram are very easy ways to start producing usable data.
Using these services, we can effectively scrape data that all users leave when their geo-location is activate on their phones/devices. The meta data that we get with location services turned on is incredibly precise. The example below is a picture I took last week while I was visiting Prague.

A photo of a sunrise in Prague and the exact location and time information (w/ MST not Prague time)
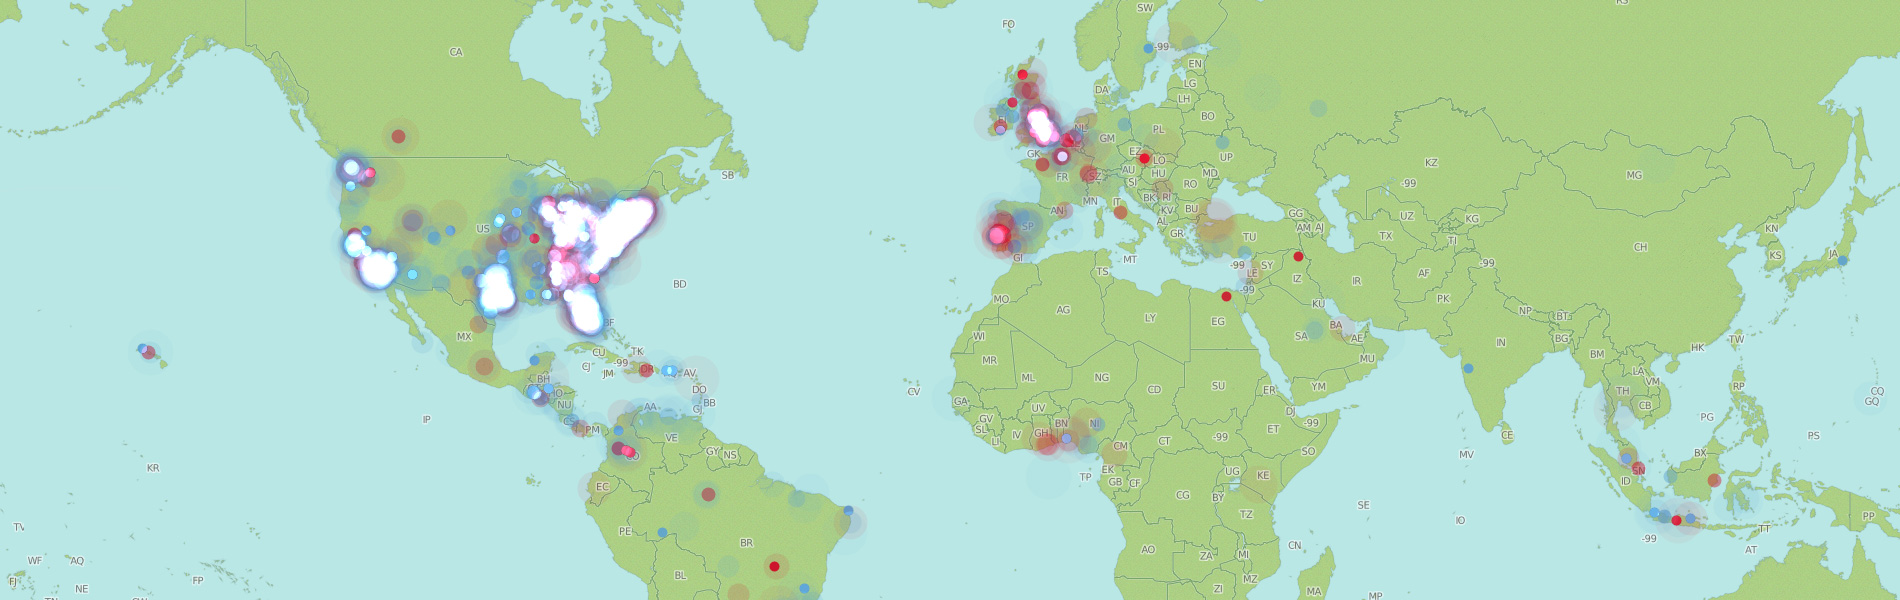
Sites like Trend Maps, help to visually correlate active #hastags and topics to their location on a map. Below is an example of trending terms being used in the Calgary vicinity on Father's Day.

Trending Data around Calgary June 15, 2014
If you want to play around with #hastag scraping my company has made a little tool that works with Twitter and Instagram which you can try here that culls for global results. We've also created another tool that accomplishes the same thing but specific to location based metadata, so we can pinpoint a location as central to a community and chart messages based on proximity.
What does this look like in action?
Let's try to imagine a central spot in my community of Mission (give or take). For this exercise, I'm going to say that middle point is the corner of 4th street and 20th ave SW. From there, I'm going to give my community a ~ 14 block radius as illustrated by the circle on the map below.

Centre of my community (give or take)
Using our location specific scraper, we could then chart the hotspots within the community. Since, it's World Cup, we can heat map the use of #worldcup hashtag in the community to see what and where the activity exists. We could decide to see that data in a bracketed time and chart it over top of the map. The example below is a bracketed view of an afternoon with the larger darker circles representing more action with that hashtag. It would not be surprising if most conversation about #worldcup is coming from the community bars, because of the density of population at those specific times.

Potential World Cup Heat Map on Friday, June 13, 2014
This example, is very cursory, but shows how scraping data could be used to understand traffic flow, migration patterns and community involvement. It's an easy example to begin breaking down the basics of a newer understanding of community involvement.
***********

Real-time Heat Mapping of the World Cup game with Portugal vs. USA
There's a great post over at cartodb that helps illustrate the above concept during a World Cup match with real-time heat mapping over the course of the match -- Go see the video, it's pretty interesting (and short). I believe it's possible to take this type of idea and apply it so that we can better understand the "micro" elements of our communities.
*It is worth noting that there are inherent privacy concerns involved with a project like this. There's a nice article over at the Daily Dot that explores an app that was built to raise awareness over location tracking and some assistance on turning off your device's meta data.